
The Qualia Analytics dashboard organises and processes collected entries to display current data in real-time. It provides multiple survey management tools, including raw data and charts export, survey sharing and paper survey management. It is divided into different sections, which are described below:
Main Menu
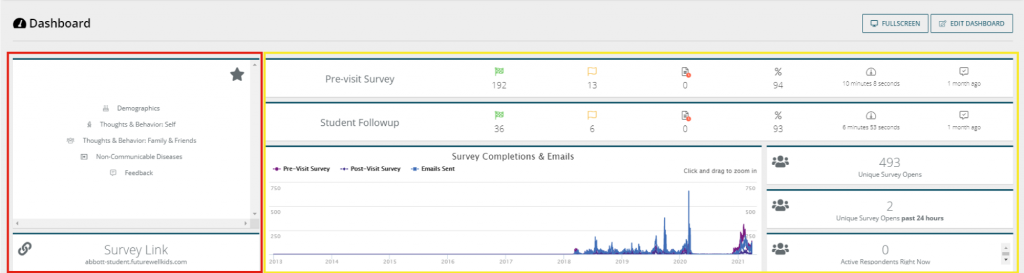
The dashboard is organised into sections, which can be accessed through the main menu bar at the top of the screen. The sections can be categorised into three groups, which have been highlighted in the screenshot below. These are: Dashboard (red), Analytics Pages (yellow) and Entries (green).

The purposes of these groups have been described in more detail below:
The dashboard displays a collection of customisable widgets. These widgets have different functionalities, which can aid navigation (red) or summarise real-time data collection (yellow). They allow for a quick view of important information, such as the number of survey opens and completions, respondent locations, and reminder emails sent.
These pages organise question-level survey data into charts. These charts help you understand the data by presenting it in a visual format, which is accompanied by its descriptive statistics. Visualisation types available include pie and bar charts, tables and word clouds, and are updated in real-time. These pages are usually listed in the same order as the corresponding questions appear in the survey.
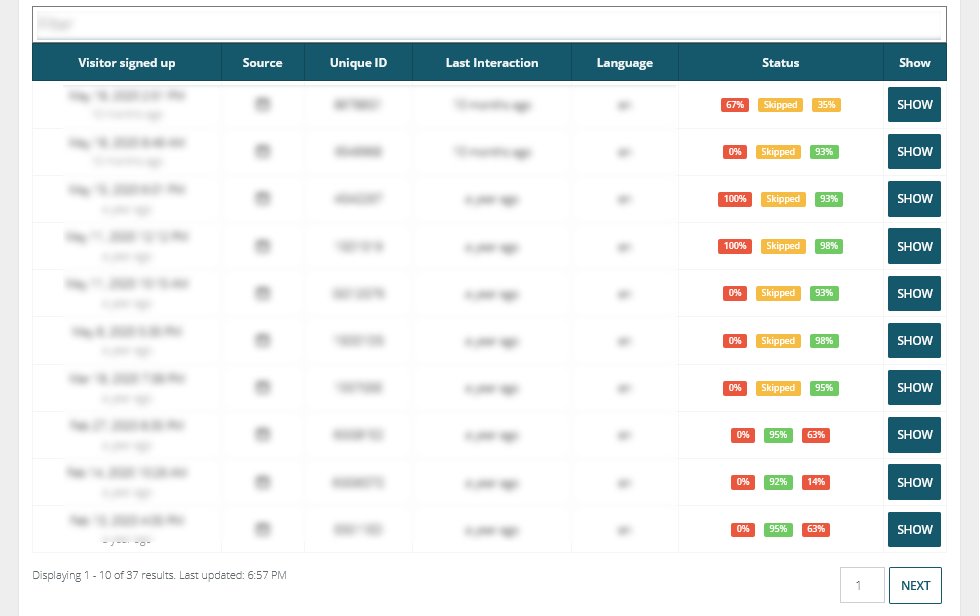
The entries page organises data at the respondent-level into a table. The information presented may vary but usually includes the sign-up date, a respondent’s unique ID (assigned by the system), their IP address, and the language of the survey response.
The last two columns are fixed. The first, titled survey status, will state a percentage, “skipped”, “partial”, “complete” or “incomplete” to show survey completion status for each respondent. The second, titled show, allows you to view the individual respondent information and surveys in more depth.
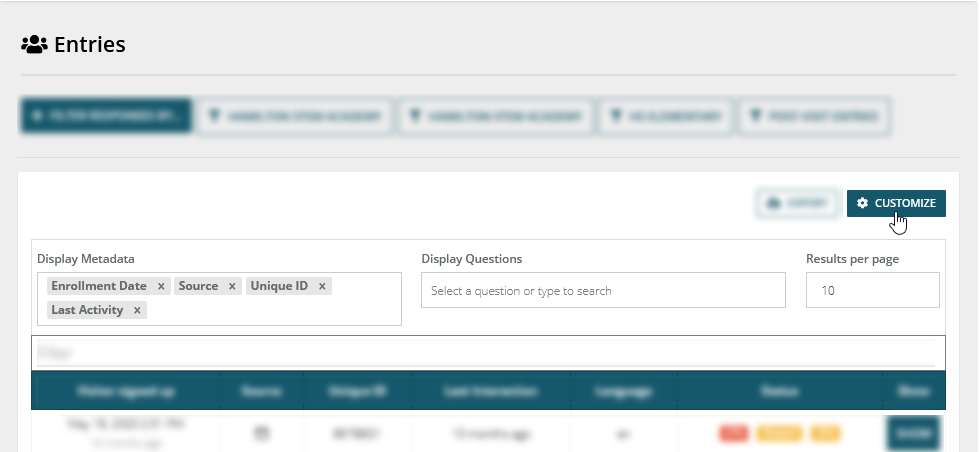
The table can be customised to add or remove information columns and change the number of results per page. The customize button can be found at the top right of the table:
Submenu
The submenu is displayed below the main menu and contains tools to manage and export survey data:
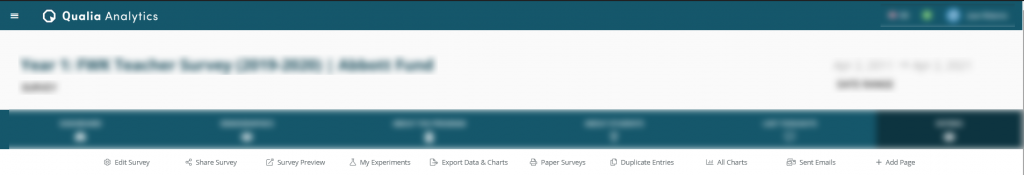
- Share survey provides different options to share and embed your survey, and to manually input data.
- Survey preview shows a preview of the whole system, including the survey form, submission messages and email messages.
- My experiments is a private place to add or remove charts and data summaries. Other users in your team will not have access to any modifications made here.
- Export Data and Charts allows data and charts to be exported in different formats.
- Paper Surveys manages the paper survey actions, which includes generation, uploading and verification.
- Duplicate Entries allows you to review and merge duplicate entries (manager-level access only).
- All charts shows all survey charts in one place.
- Sent emails lists all sent emails with a link to their corresponding respondents.
- Add page creates new dashboard pages (manager-level access only).